Intro to Plot.ly
- Plot.ly is the tool we will use to make our interactive visualisations.
- Use its web interface to
- load data
- select data for a plot
- manipulate the look and feel of the plot
Below are headings and gifs that provide a tour of the plot.ly web interface
Tour of Plot.ly
You should be looking at me (Errol), but if you missed me or I’m insufferable, the essentials are demonstrated below.
Start Plotting
New Spreadsheet
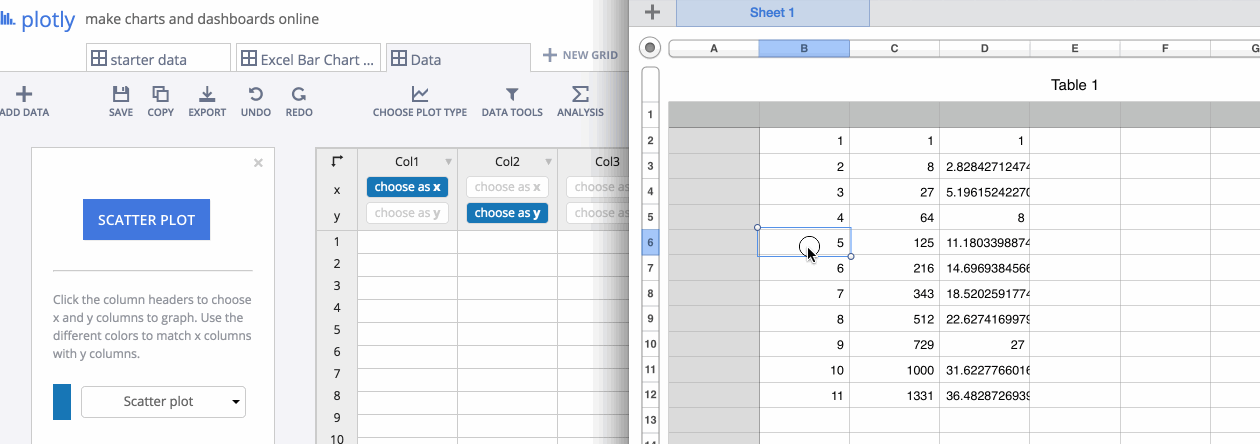
Paste Data (from Excel or Google Sheet etc)
- ctrl + c and ctrl + v …
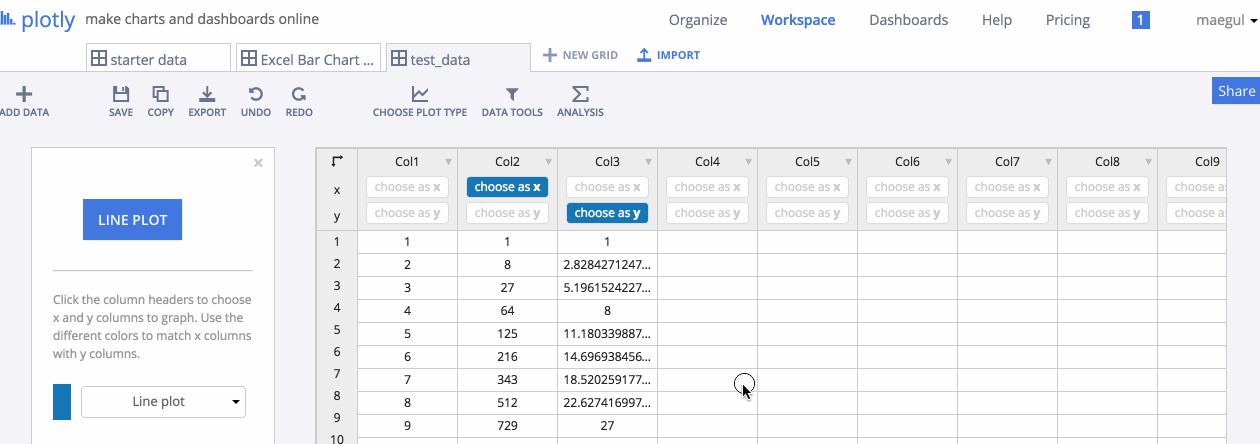
Save Data
- Once saved, the spreadsheet can be retrieved later or easily shared.
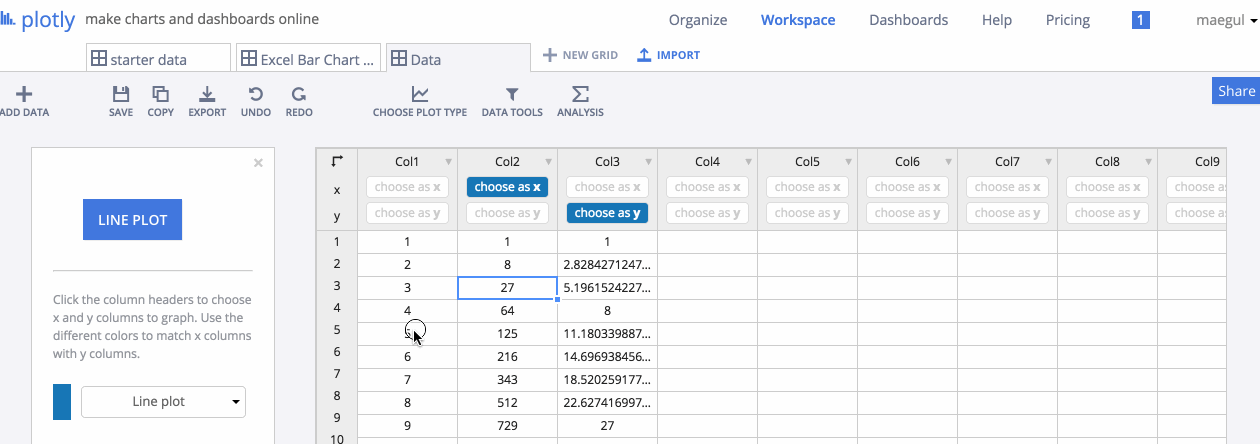
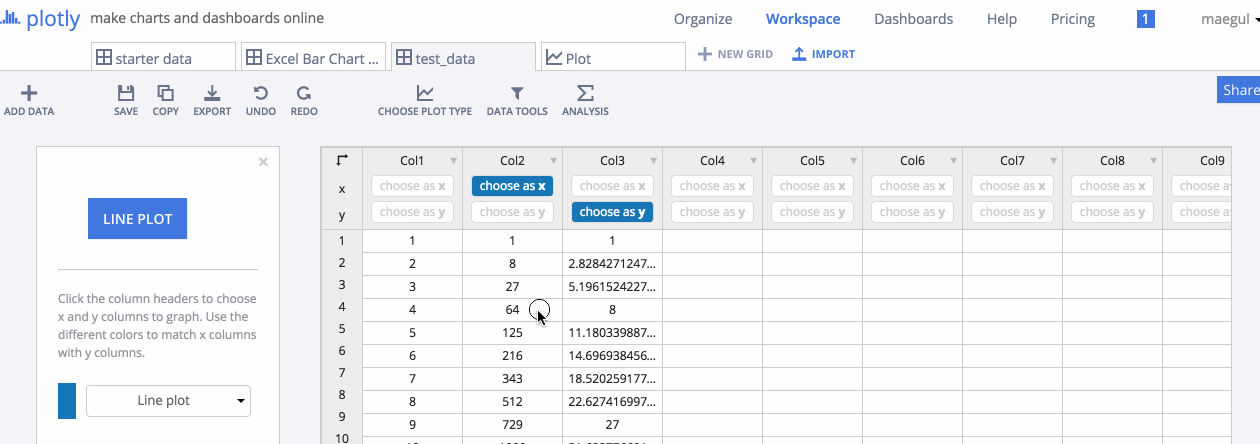
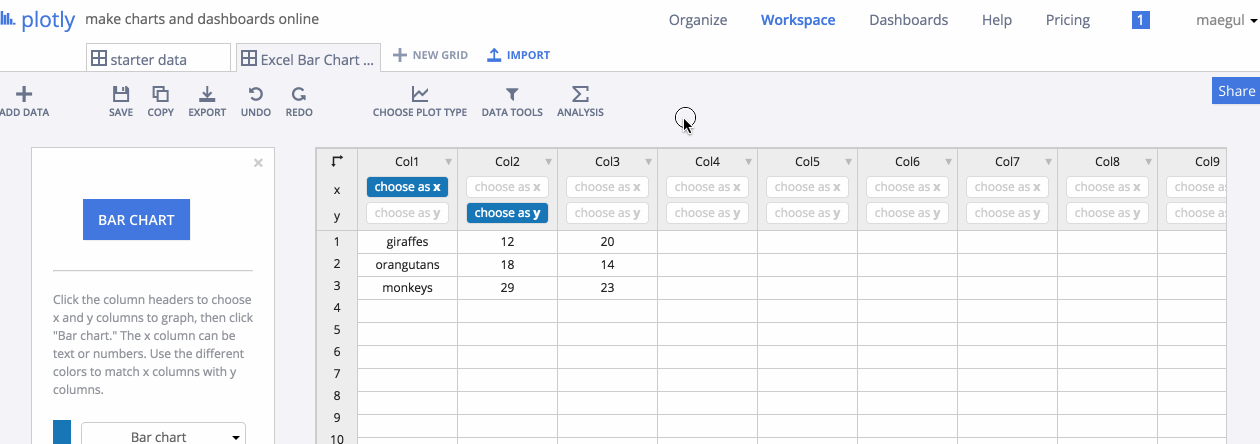
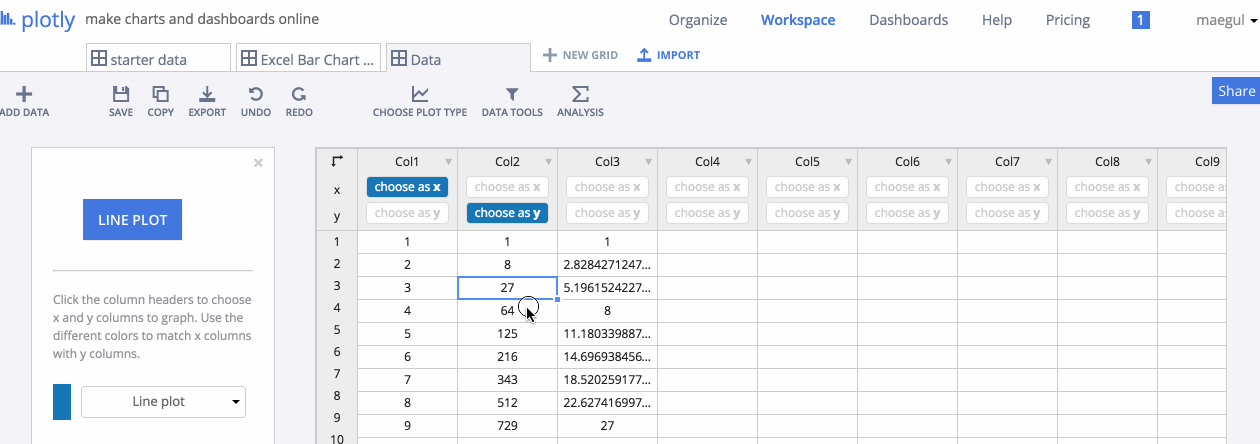
Choose Plot type
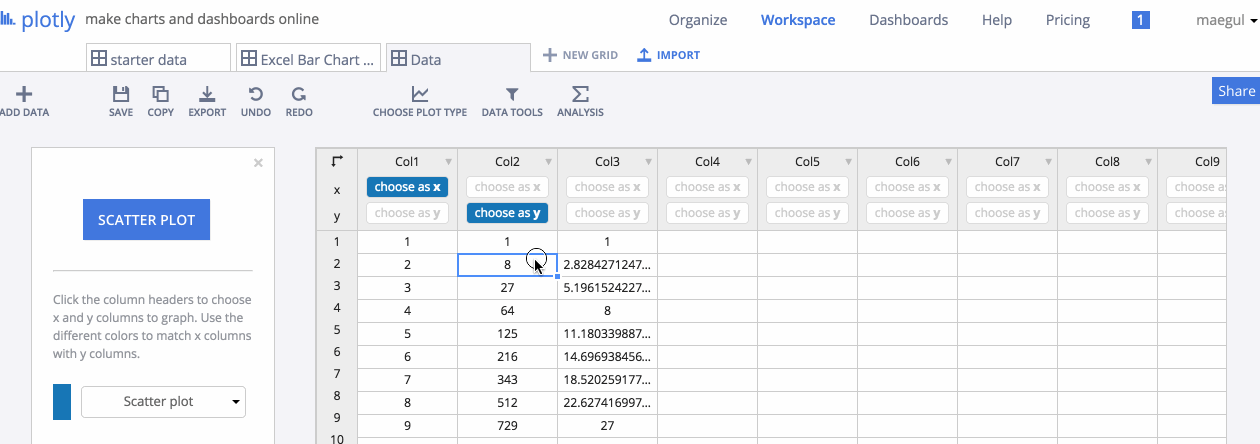
Select Data (for the plot)
- Plot.ly thinks in terms of columns. A variable or axis (x or y etc) is a column.
Make the Plot
Edit the Plot
- There are a number of ways in which the plot can be manipulated. They are all located in the left side menu bar