We’ll be using climate change as the topic of our blog post and data visualisation.
Question: Has Melbourne’s weather undergone climate change.
Get the Data
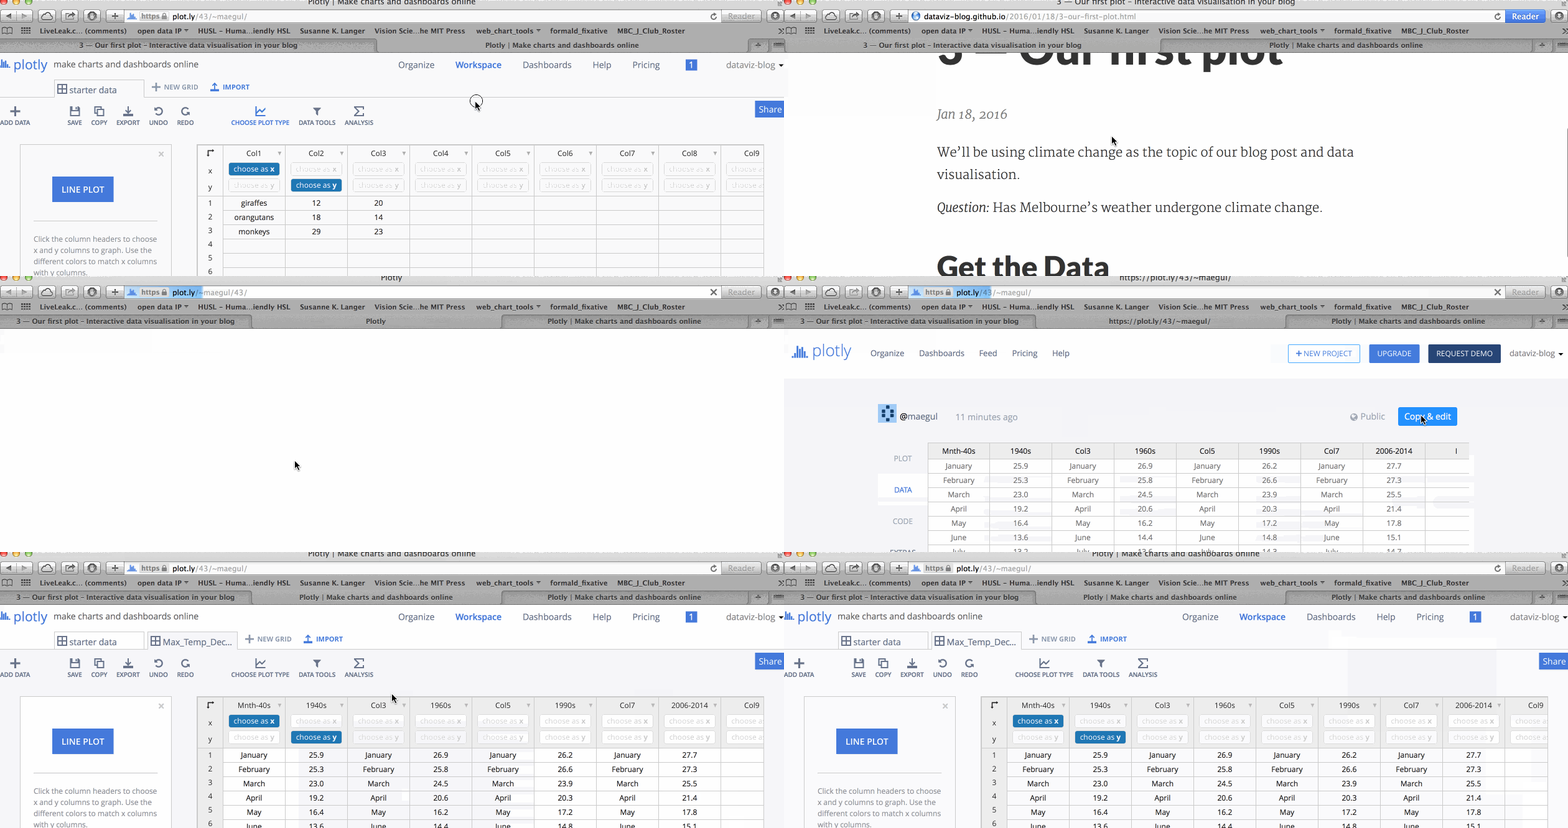
Plot.ly makes sharing data easy. Take this link from my personal plot.ly account.
Make sure to Copy and Edit and save to your own account.

Notes about the data
- Sourced from the Bureau of Meterology.
- For each month, daily maximum temperatures were averaged.
- Then for each of the decades, these monthly averages were themselves averaged.
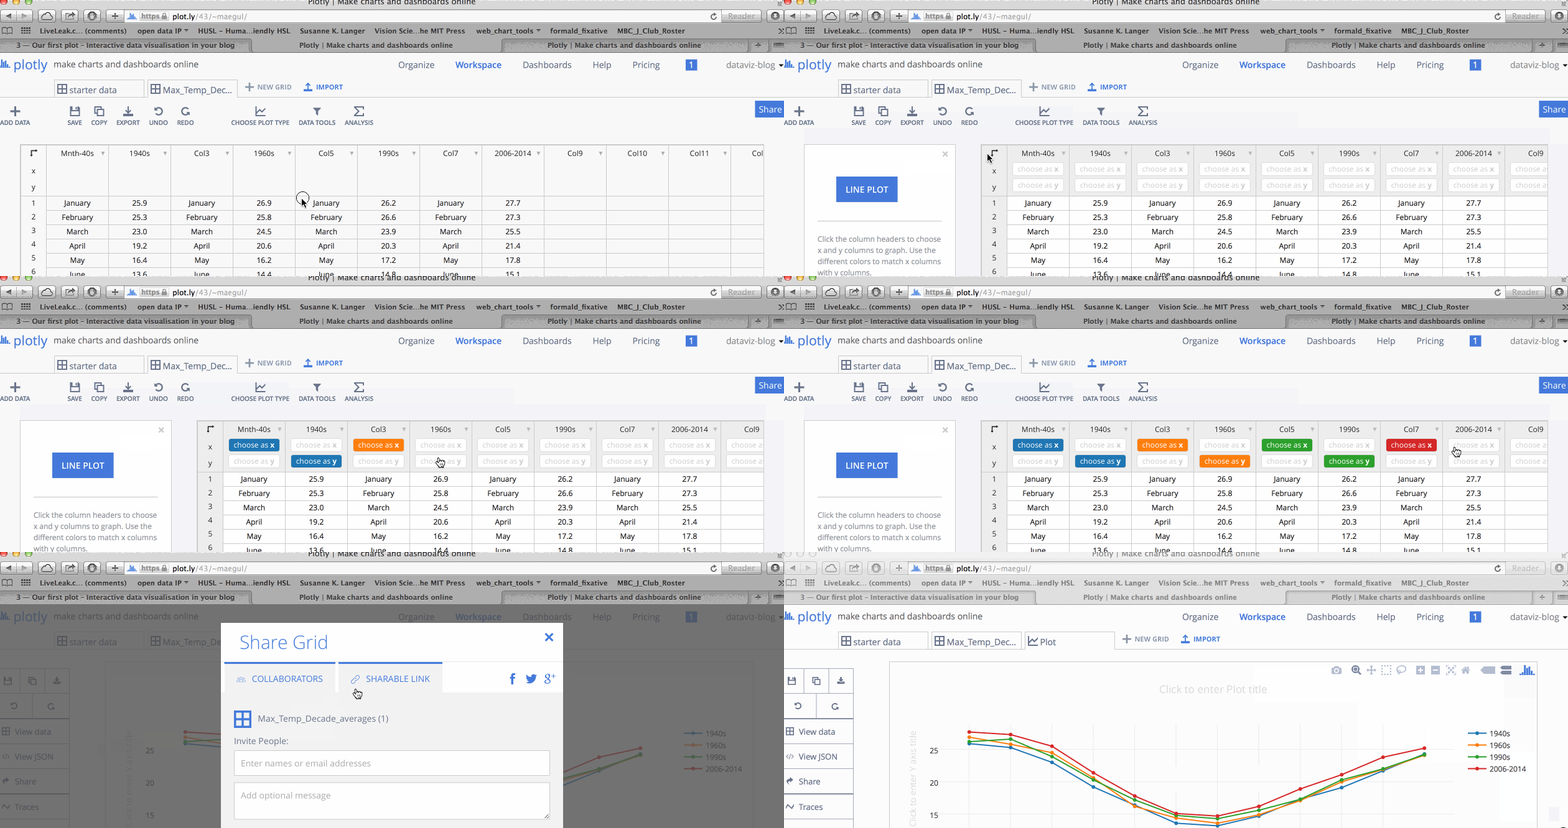
Make a Plot

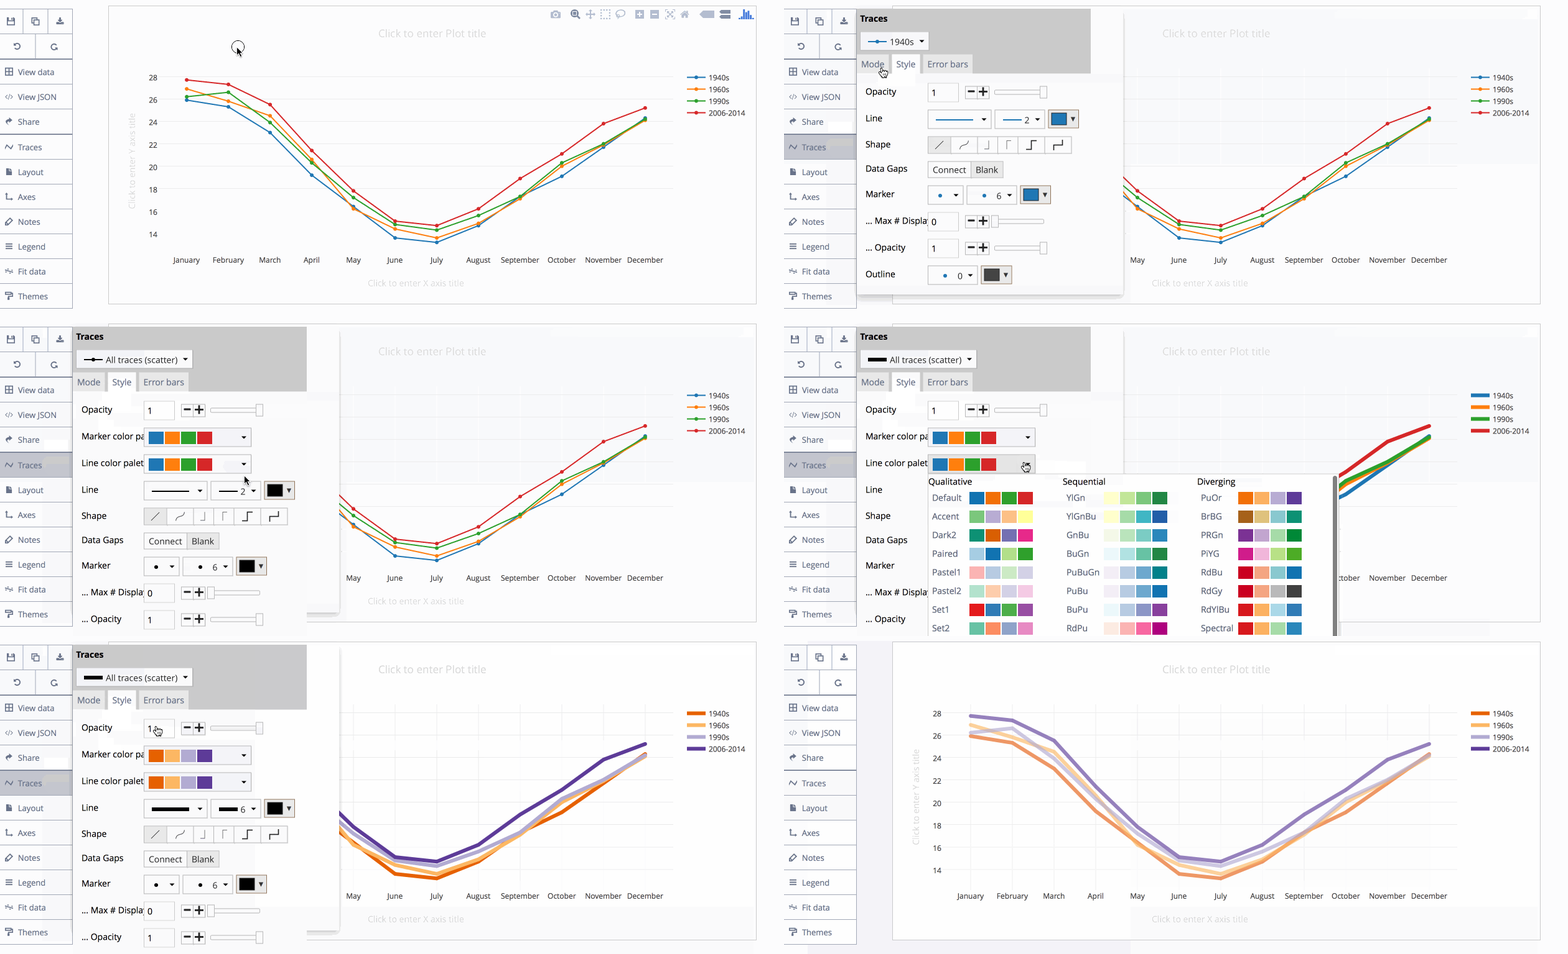
Style the Plot

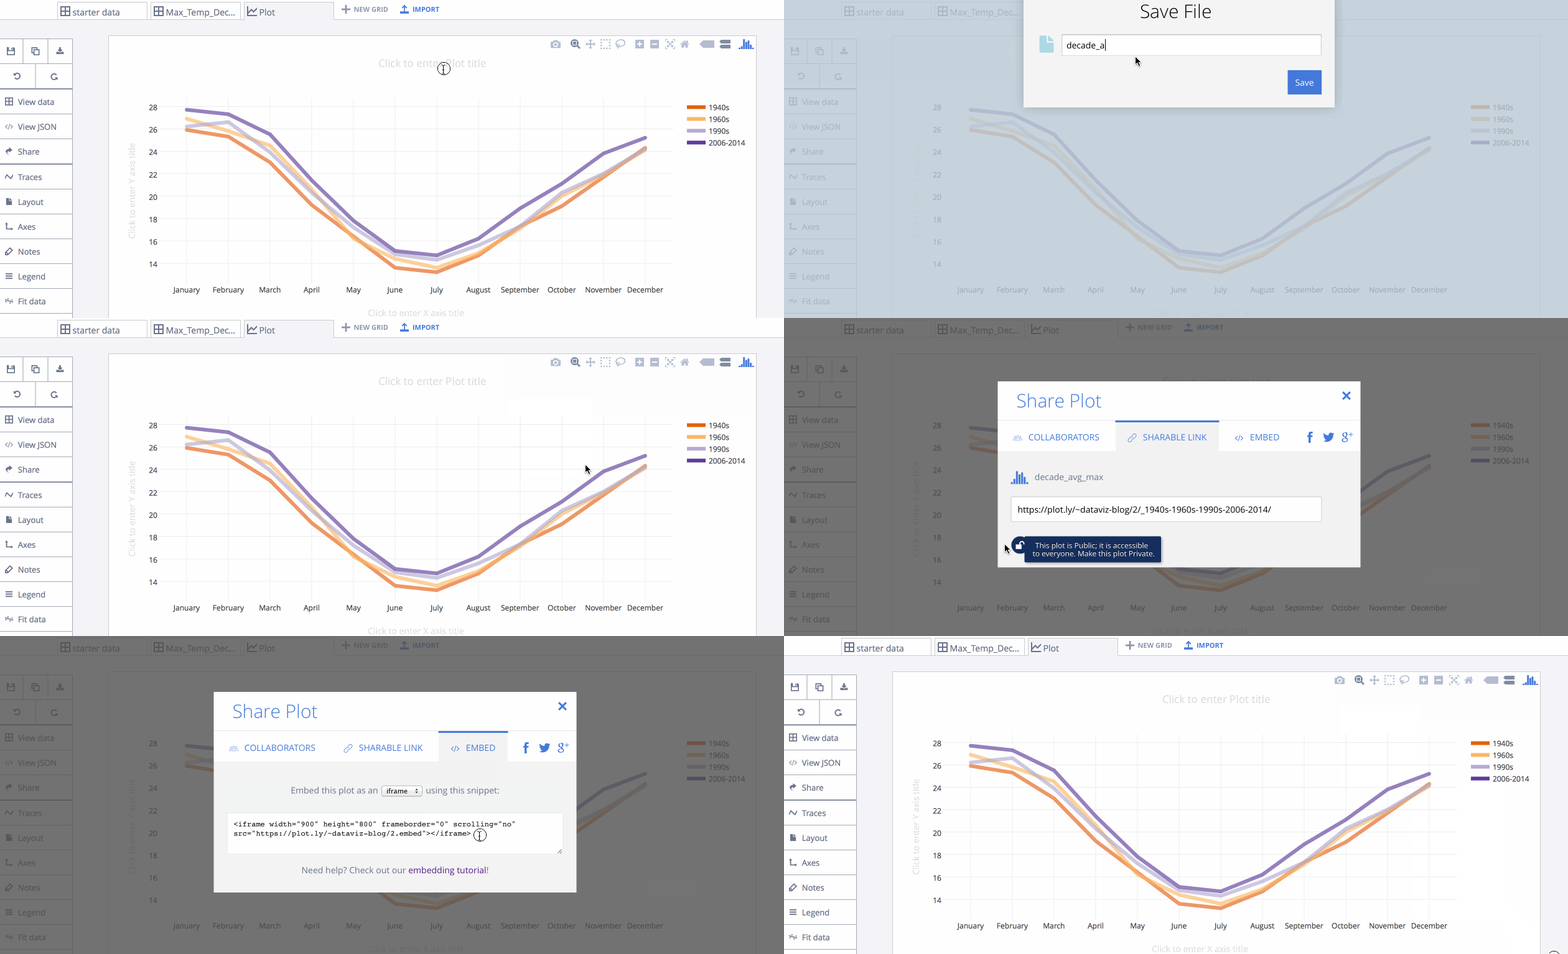
Save and get link for Blog Post
